
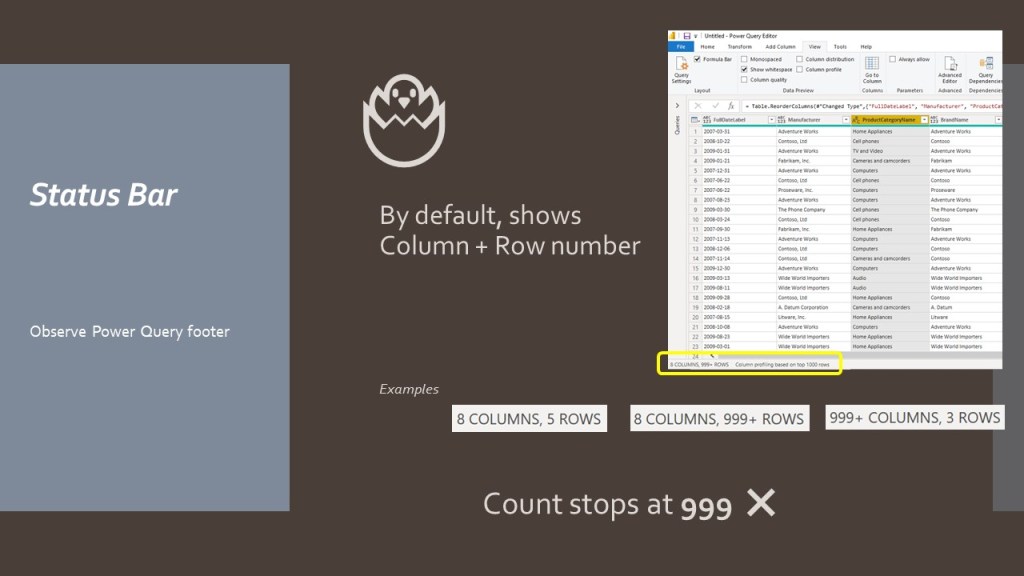
Find the footer value


This area displays information on columns and rows loaded in Power Query.

What’s wrong with the row counter?
I import a huge data set in Power Query, but the row count stops at “999+”.
Can I obtain full detailed info. on data set I have just imported in my query?
The answer is yes, the information is available, but there is a trade off.
Full profiling is resource intensive and will slow down your Power Query Editor.
As a rule of thumb, you activate full profiling on small data sets and simple queries.
In above example, it takes 30 seconds to obtain full profiling on a 800K rows, 7 columns clean data set.
It is true I do not have a last generation laptop, but this illustrates how resource-intensive profiling is.
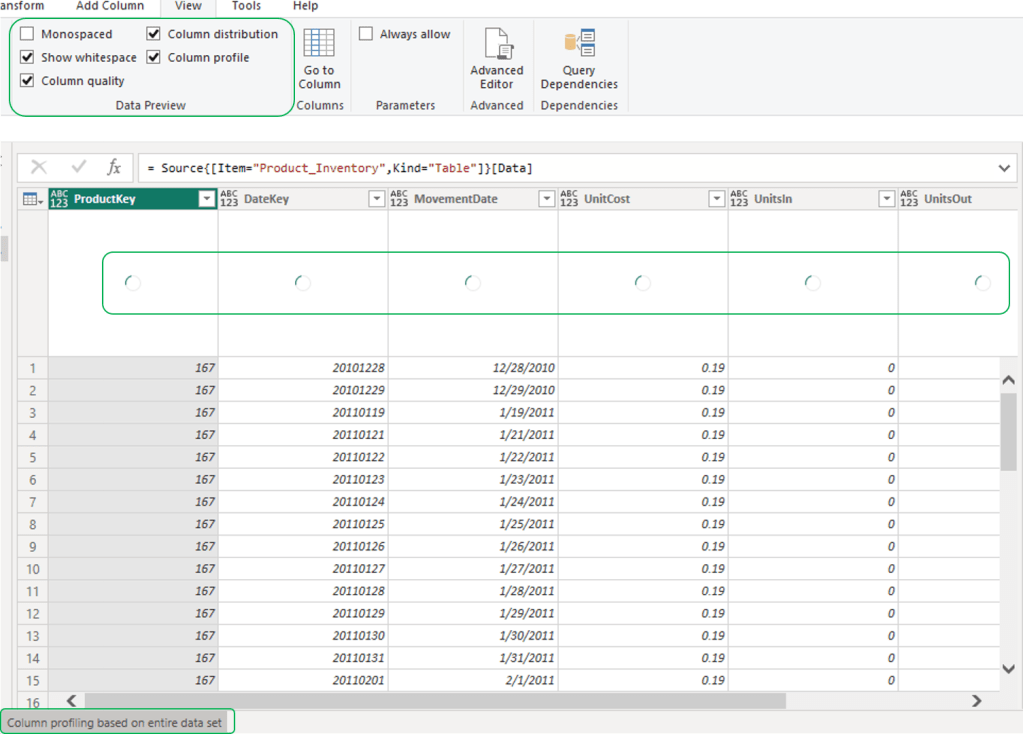
Activate column profiling on full data set:
Screenshots in below slides
- Click the Status Bar area. This is area is clickable although not a real button
- Activate “Column profiling based on the entire dataset” by clicking the dialog
- In View menu, click a column header, tick Column Distribution, Column Profile and Column Quality boxes
- Save your changes if you want to see this information on next query opening
Recap:
- Activate the “entire profiling option” to detect anomalies at cleaning or early data preparation stage
- Stick with the default sampling to identify major issues in your regular activities
See below 2 pager to document Power Query column profiling


Read more on Power Query User Interface in “The Power Query editor user experience” paragraph.
You can follow this link to read my blog post on Applied Steps and Formula Bar.
Hope you enjoyed the read!

Leave a comment